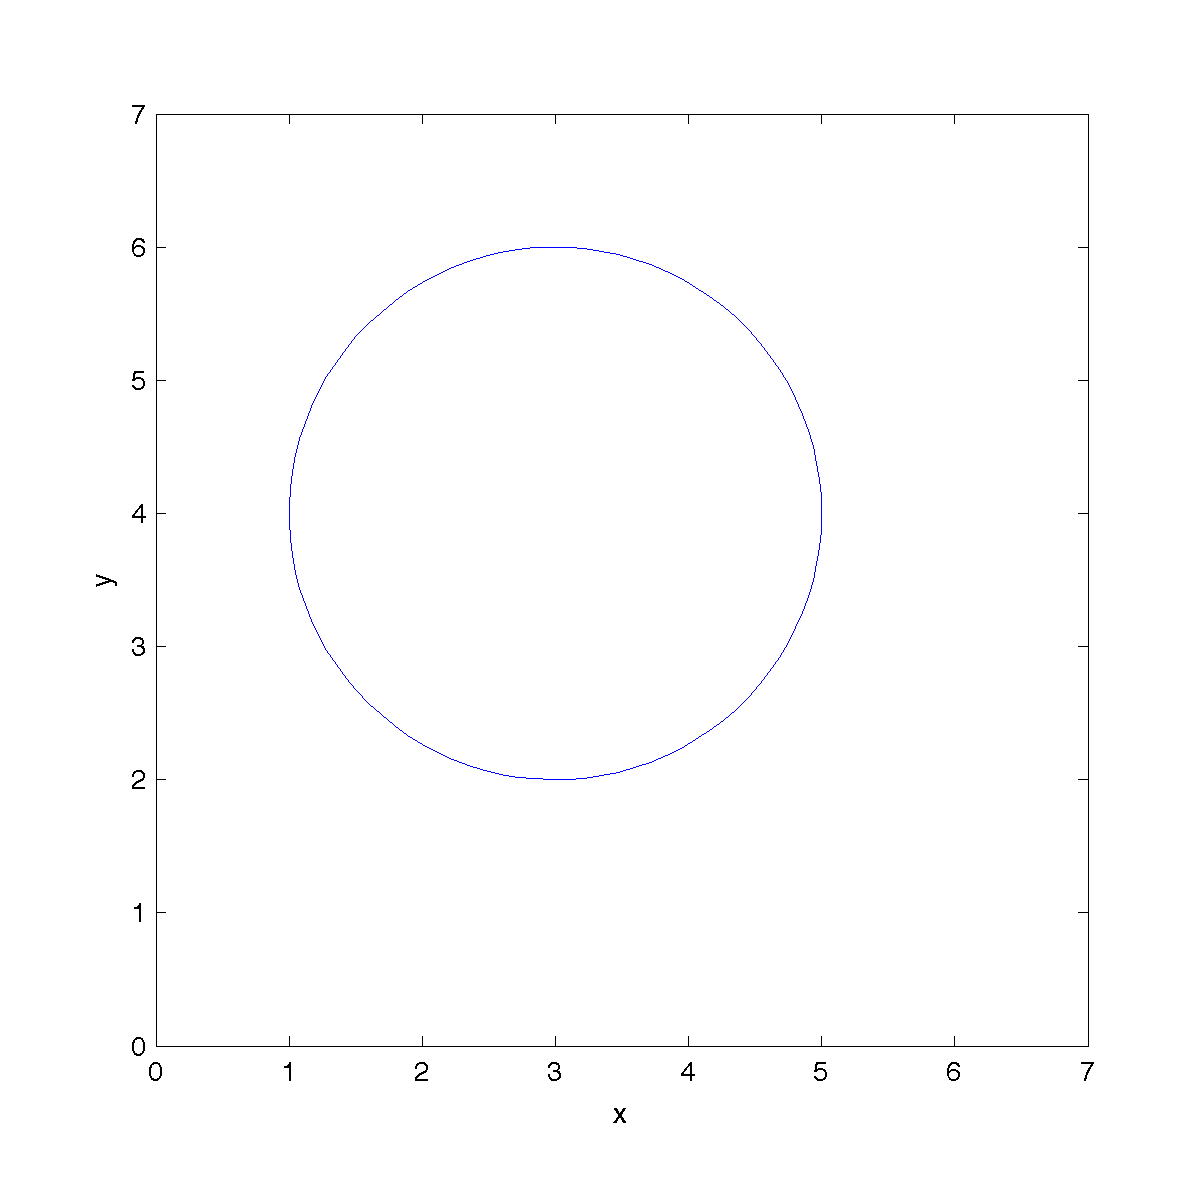
Plotting a Circle
Plot a circle with radius R, centered at coordinates (x0, y0). We create the circle in polar coordinates and then transform to Cartesian coordinates using the built-in function pol2cart.

% circlePlot.m
%
radius = 2;     % radius of circle
x0 = 3;         % x center of circle
y0 = 4;         % y center of circle
N = 100;        % number of points used to define circle

% create equal length arrays defining a circle in polar coordinates
theta = linspace(0,2*pi,N);
r = radius * ones(1,N);

% convert polar coordinates to Cartesian coordinates
[x, y] = pol2cart(theta, r);

x = x + x0;         % offset the circle so its center lies at (x0, y0)
y = y + y0;

plot(x,y,'b-');     % plot as blue line

xlabel('x')         % label axes
ylabel('y')

axis equal          % equal axis scaling so our circle looks circular

xlim([0 7]);        % set plot limits
ylim([0 7]);
Monkey Commentary:
theta = linspace(0,2*pi,N);
This line and the next define a circle in polar coordinates. This line creates an array theta containing N equally spaced numbers ranging from 0 to 2*pi.
r = radius * ones(1,N);
Next, we create an array r that will store the radius for every theta value we defined. The ones(1,N) command creates a 1xN row matrix filled with ones. Multiplying by radius creates an array with the value radius in each element. Given that N = 100 and radius = 2, our arrays will contain the following values:
theta = [0 0.0635 0.1269 0.1904 ...]
r = [2 2 2 2 ...]
[x, y] = pol2cart(theta, r);
The pol2cart function converts polar coordinates (theta, r) to Cartesian coordinates (x,y). This function is equivalent to the following transformation:


axis equal
The axis equal command ensures that the unit length along the x axis matches the unit length in the y direction, i.e. it guarantees that the circle will look circular.
