
plot05.m - Graphing Two or More Things on the Same Plot
x = linspace(0,2*pi,100);   % 100 data points evenly spaced from 0 to 2*pi
y = sin(x);                 % first curve has a phase = 0
y2 = 2 * sin(x - pi/6);     % second curve has a phase = pi/6
y3 = 3 * sin(x - pi/3);     % third curve has a phase = pi/3

plot(x,y, x,y2, x,y3)       % plot all three curves

xlabel('x')
ylabel('Wave height')
title('Three Sine Waves', 'FontSize',14)
axis([0 2*pi -4 4])
legend('sin(x)', '2 sin(x-\pi/6)', '3 sin(x-\pi/3')
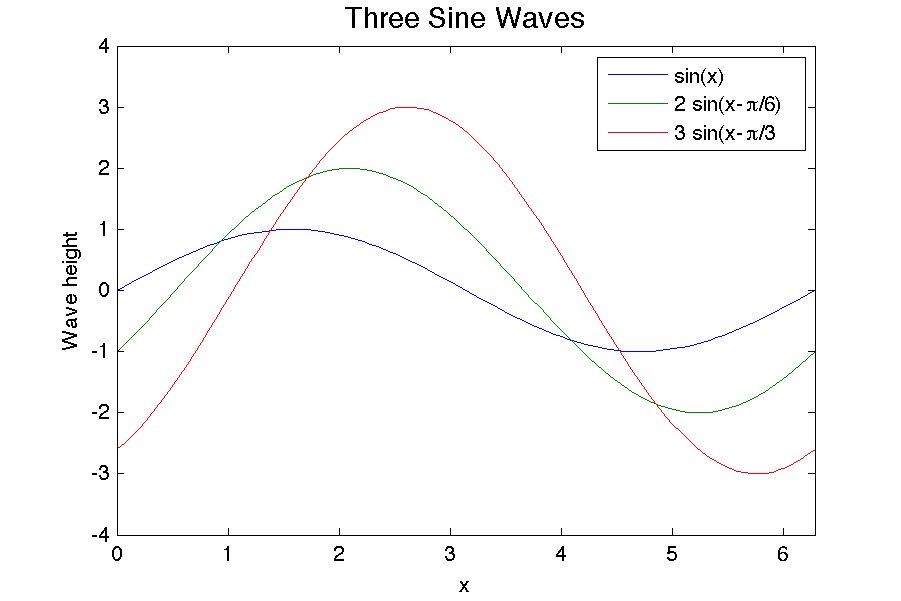
This example demonstrates the simplest way of graphing two or more things on the same plot. The command plot(x,y, x,y2, x,y3) will graph y vs. x, y2 vs. x and y3 vs. x on the same plot. You can include as many pairs (i.e. x,y4 etc.) as you like. Matlab automatically picks different colors for the curves. You can also choose to define different x arrays for each function. In other words the command plot(x,y, x2,y2, x3,y3) works just fine as long as the arrays x and y have the same lengths, x2 and y2 have the same lengths, and so on.
The command legend() creates a legend in the top right corner of the plot. You must include the same number of text strings in the legend command as there are curves (in this example 3). The first string 'sin(x)' will label the first curve, the second string '2 sin(x-\pi/6)' will label the second curve, etc. You can choose any text you want for these labels.