
plot04.m - Printing and Saving Plots as PDF Files
x = 0:0.5:10;   % x values range from 1 to 10 in steps of 0.5
y = x.^2;       % squre each element in x array and store in y

% plot y vs. x
plot(x,y,'bo','MarkerFaceColor','b')

xlabel('x (m)')     % label horizontal axis
ylabel('y (m^2)')   % label vertical axis
title('y = x^2')    % title

h = 4;                                  % height of plot in inches
w = 6;                                  % width of plot in inches
set(gcf, 'PaperSize', [w h]);           % set size of PDF page
set(gcf, 'PaperPosition', [0 0 w h]);   % put plot in lower-left corner
print ('-dpdf','plot04.pdf');           % save plot as pdf file
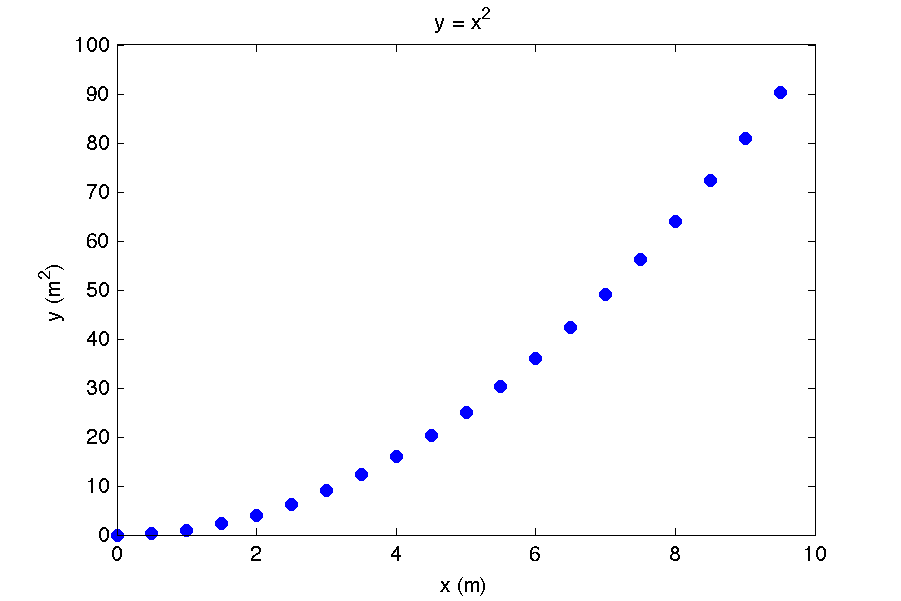
This example demonstrates how to save a plot to a pdf file. The variables h and w hold the height and width of the plot (in inches). The command set(gcf, 'PaperSize', [w h]) defines the size of the pdf file and the command determines where on the pdf file the plot will appear. The final command print ('-dpdf','plot04.pdf') saves the plot to a file called 'plot04.pdf'. The command print is a bit of a misnomer, since it doesn't actually print anything to a physical printer. It just saves the file.
Matlab can save plots in many different file types. Here are a few more possibilities:
print ('-dpdf','test.pdf');     % PDF file (vector)
print ('-deps','test.eps');     % Encapsulated Postscript B&W (vector)
print ('-depsc','test.eps');    % Encapsulated Postscript color (vector)
print ('-dtiff','test.tiff');   % tiff file (bitmap)
print ('-djpeg','test.jpg');    % JPEG file (bitmap)