
plot03.m - Annotations and Greek Letters
x = linspace(0,2*pi,60);     % define 60 x values from 0 to 2 pi
y = sin(x);                  % calculate sin(x)
plot(x,y,'bo')               % plot y vs. x

% set the plot limits on the x and y axes
xlim([-0.2 2*pi+0.2]);
ylim([-1.2, 1.2]);

% label x and y axes and give the plot a title
xlabel('\theta');
ylabel('sin(\theta)');
title('Annotation Example');

% calculate the index of the middle data point
% Use the x and y coordinates of this data point to position a text
% annotation. Then write some randon Greek letters near the bottom of the
% plot (just because I can).
mid = round(length(x)/2);
text(x(mid)+0.1,y(mid),'\leftarrow Here is my favorite data point');
text(0.1,-1,'Some random Greek letters:  \alpha, \theta, \Sigma, \phi, \pi');
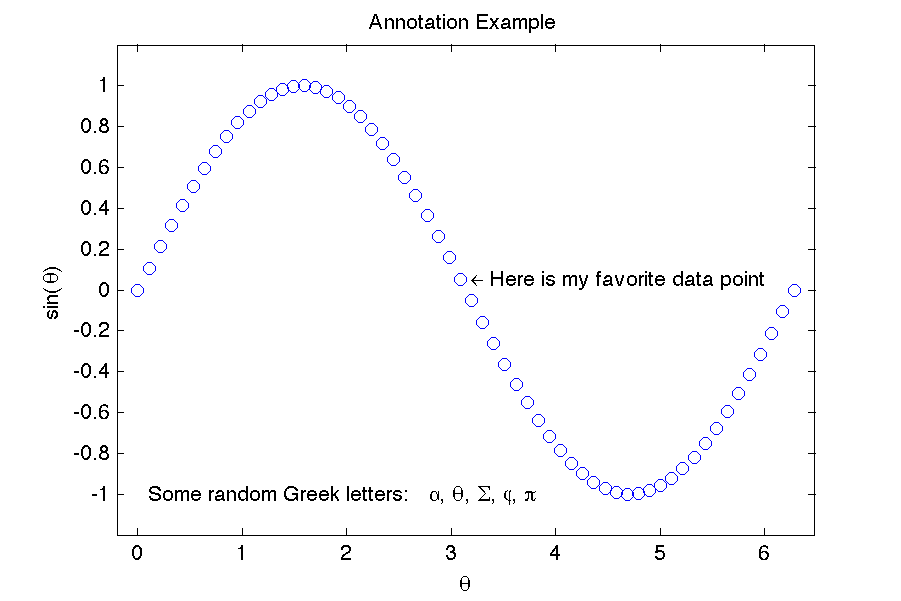
This example plots sin(x) vs. x using open blue circles and annotates it with some text. A few things to notice about this code:
- The linspace(0,2*pi,60) command is used to create an array of 60 points evenly distributed from 0 to 2*pi.
- the plot limits are slightly expanded along the x axis (compared with example plot02.m) to make room for the width of the markers.
- Greek characters are used in creating the axis labels. To create a Greek character in a text label, just spell out the name of the character and precede it with a backslash. For example the strings '\alpha', '\beta' and '\gamma' produce
 ,
,  and
and  . To create a capital Greek letter, just capitalize the first letter, i.e. '\Sigma' produces
  . Some Greek letters are the same as thier Roman counterparts. In these cases, Matlab does not recognize the spelled-out version. In those cases, you just need to type the Roman character. For example, Matlab does not understand \omicron because that Greek symbol is just the same as an 'o'.
 - The code writes a text annotation to the right of the middle data point. In order to know which point is the middle one, we use the length() command to first find the length of the array x. The middle data point is then at index length(x)/2. We round the result off to the nearest integer in the event that the length of x turns out to be odd. BTW, it is much better to calculate the length of x dynamically like this rather than just setting it to 60 by hand, because if someone later comes in and changes the number of data points, then the code will still figure out which data point is in the middle.