
plot07.m - Overlaying a sine function on noisy data
period = 10;                  % define the period of the signal
t = linspace(0,period,200);   % 200 data points evenly spaced over 1 period

% create a sine wave and add Gaussian noise to it
% plot as blue data points
y2 = sin(2*pi/period*t) + 0.5*randn(1,length(t));
plot(t,y2,'bo', 'MarkerSize',2, 'MarkerFaceColor', 'b');

% prevent future plots from overwriting current plot
hold all

% create a sine wave with no noise and plot as red curve
y = sin(2*pi/period*t);
plot(t,y,'r-')    % red line

% label axes
xlabel('t')
ylabel('y(t)')
axis([0 period -4 4]);
legend('sine + noise','sine');
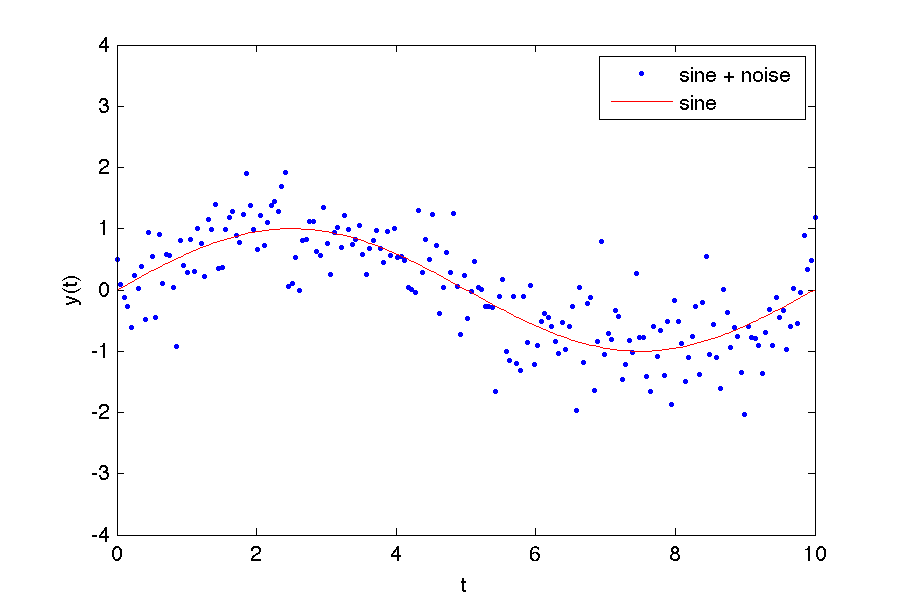
This code is an example of a common problem in experimental physics. You want to overlay a theoretical model curve on some noisy data to see if your model matches the data. In this case, we 'faked' a data set by just added Gaussian noise to a sine wave.
The noise is created with the randn() command. It generates an array of random values drawn from a Gaussian distribution with mean = 0 and variance = 1.
We use the hold all command to prevent the second plot from overwriting the first.