
plot08.m - Putting Multiple Plots on One Page
x = linspace(0,50*pi,1000);  % define 1000 x values from 0 to 50 pi

% two sine waves beating near 1:1 "resonance"
y = sin(x)+sin(1.1*x);
subplot(3,1,1);             % three horizontal panels, plot top one first
plot(x,y)
axis([0 50*pi -2.2 2.2])
ylabel('y')
title('1:1 Beats    sin(x) + sin(1.1*x)', 'FontSize',12)

% two sine waves beating near 2:1 "resonance"
y = sin(x)+sin(2.1*x);
subplot(3,1,2);             % now make a plot in the middle panel
plot(x,y)
axis([0 50*pi -2.2 2.2])
ylabel('y')
title('2:1 Beats    sin(x) + sin(2.1*x)', 'FontSize',12)

% two sine waves beating near 3:1 "resonance"
y = sin(x)+sin(3.1*x);
subplot(3,1,3);             % this plot will be in the bottom panel
plot(x,y)
axis([0 50*pi -2.2 2.2])
title('3:1 Beats    sin(x) + sin(3.1*x)', 'FontSize',12)
ylabel('y')
xlabel('x')                 % label the x axis only on the bottom plot
                            % the x label bumps into the title on the upper
                            % plots
Sometimes we want to compare curves, but overlaying them on the same plot is messy and confusing. In these cases we'd prefer that each curve appears on its own plot. The subplot() command creates a grid of plots on the page. We create a given plot with the following command
subplot(ny, nx, n)
where ny is the number of plots spaced vertically on the page, nx is the number of plots spaced horizontally, and n is the plot number (the plots are numbered starting in the upper right corner and count across each row down the page). Thus, subplot(3,2,4) would create a grid 3 plots tall and 2 plots wide, and create a plot 2 over and 2 down from the top left corner. subplot(3,2,1) would create a plot in the top left corner of the page.
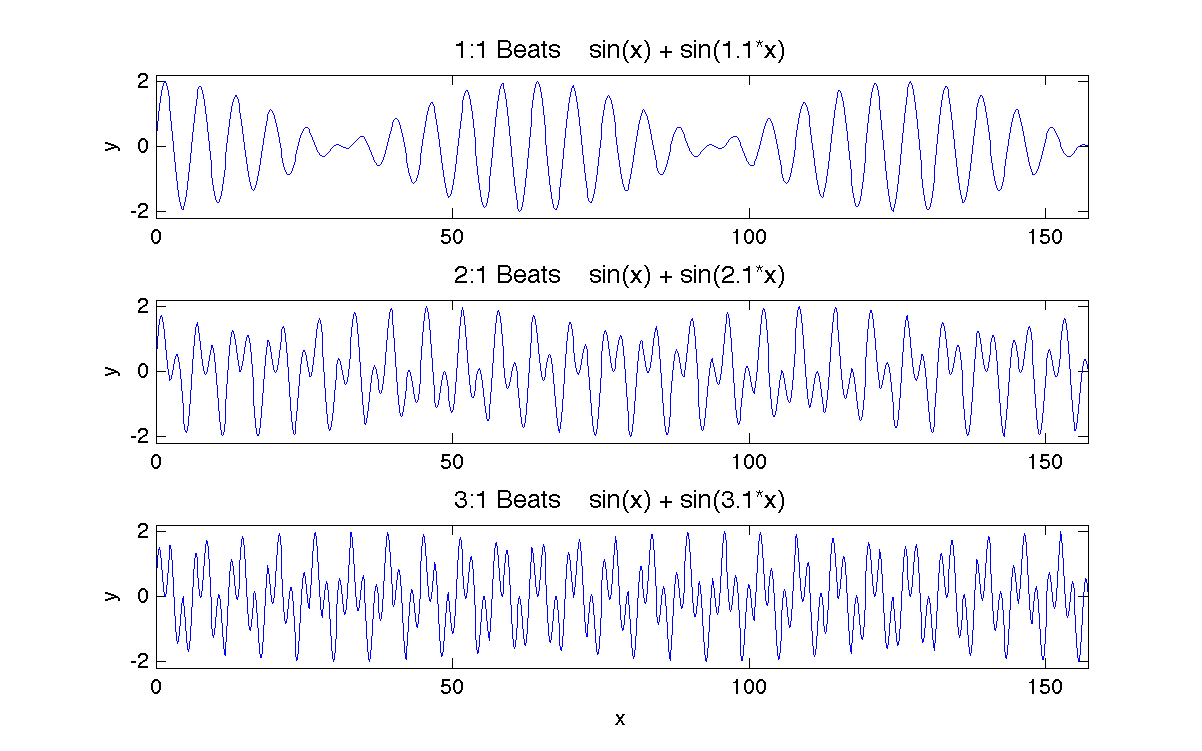
The plots displayed above show the effect of adding two sine waves. The top plot shows the well-known phenomena of beats. When two waves are close in frequency, a low-frequency modulation appears creating a series of wave packets. When one wave has nearly twice the frequency of the other, a combination tone is created (these are also called Tartini tones in music). The structure of these 2:1 beats are more complex than standard 1:1 beats and can be difficult (but not impossible) to hear. The lower panel shows 3:1 beats.