
plot10.m - Plot a Grid of Lissajous Figures
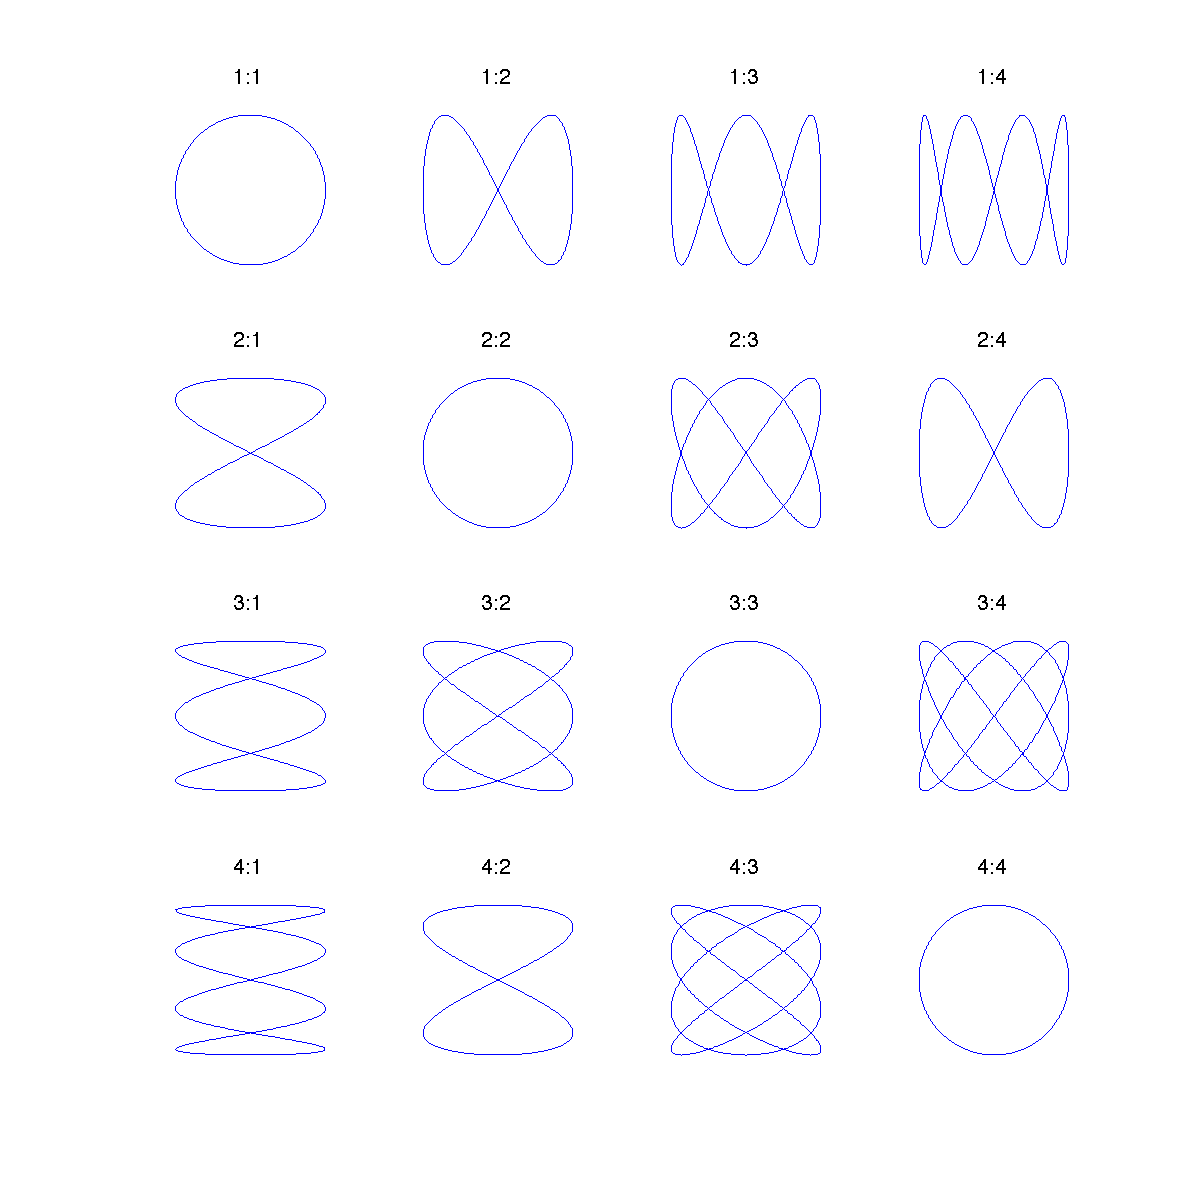
N = 4;            % Number of plots along x axis
M = 4;            % Number of plots along y axis

for kx = 1:N
    for ky = 1:M
        % The period of the pattern will be 2*pi, unless the two wavenumbers
        % share a common divisor. If they do share a common divisor, then the
        % period will be reduced by that common factor. Use the greatest
        % common divisor function gcd().
        period = 2*pi/gcd(kx,ky);
        t = linspace(0,period,1000);

        % figure out the phase shift that "rounds out" the pattern
        phase = ky*period/4;
        x = sin(kx*t);
        y = sin(ky*t + phase);

        % plot
        subplot(N, M, (kx-1)*M+ky)
        plot(x,y,'-')
        axis equal
        axis([-1.2 1.2 -1.2 1.2])
        title([num2str(kx) ':' num2str(ky)])

        % turn off the axes
        axis off
    end
end
This program extends the example plot09.m to show a grid of Lissajous figures all on the same plot. The number of plots shown may be controlled by changing N and M (try it). The command axis off is used to turn off the plot axes making the plot look a little cleaner and easier to read.